New AI Interviewer product
Check it out
<- Back

The South African Clothing Retail Landscape Report 2024/25

Free comprehensive analysis of South Africa's R987M clothing retail market. Real bank statement data from 24 retailers revealing consumer behavior, digital trends, and strategic opportunities. Download now.

R987 Million. 24 Retailers. 12 Months. The data-driven insights reshaping how South Africa shops for fashion.

Based on real bank statement data from over 2 million transactions, this report reveals the hidden patterns driving South Africa's clothing retail market—and the strategic opportunities most brands are missing.

Every clothing retailer in South Africa is making decisions based on assumptions:

  • "Gen-Z is the future of fashion retail"
  • "Omnichannel is the only way forward"
  • "Chinese platforms compete purely on price"

But what if the data tells a completely different story?

This report is the first comprehensive analysis of South African clothing retail behaviour using actual transactional data—not surveys, not focus groups, but real purchases from real bank statements.

What we found challenges everything the industry thought it knew.

Inside the Full Report

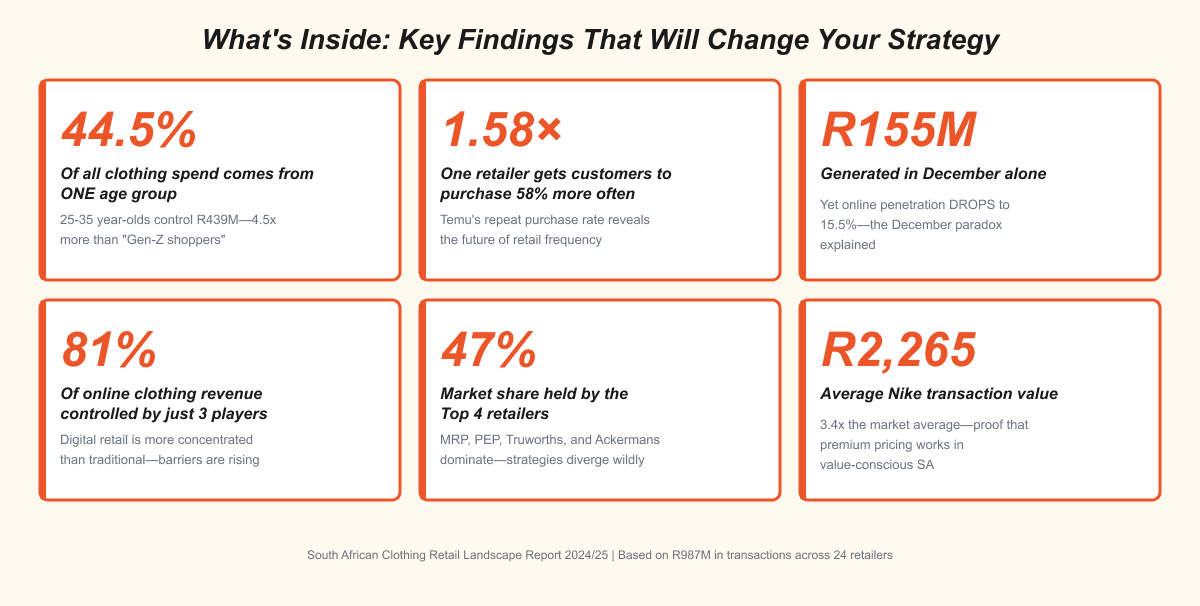
Strategic Insights You'll Discover:

  • Why the "youth market" is actually funded by millennial wallets
  • The R800-R1,000 price point gap NO retailer owns (yet)
  • Why omnichannel failed in SA—and what replaced it
  • How income mobility drives customer "graduation" between brands
  • The February financial crisis hidden in the data
  • Why digital retailers miss 43% of the year's biggest opportunity
  • Which demographic segment has the highest lifetime value
  • The transaction volume oligopoly reshaping competitive dynamics
  • Identity's digital pivot: What worked, what didn't, and why
  • Nike's premium moat: How to win without volume in a value market

Data Visualisations & Analysis:

  • 8 custom data visualisations
  • Market share evolution by channel (online vs offline)
  • Monthly revenue trends with seasonality patterns
  • Income positioning heatmap across 24 retailers
  • Age pyramid showing millennial spending dominance
  • Average order value spectrum (premium to value)
  • Repeat purchase behaviour analysis
  • Digital divide butterfly chart
  • Demographic × merchant transaction matrix
  • 50+ supporting data tables and merchant profiles
Average order value in ZAR

Research Methodology: Real Data, Real Insights

This isn't based on surveys or self-reported data.

We analyzed actual bank statement transactions from credit and mobile contract applications, covering:

  • R987 million in total clothing spend
  • 2.1+ million individual transactions
  • 1.8+ million customer instances
  • 24 clothing-only retailers
  • 12-month period (July 2024 – June 2025)

Data sourced from Reveal × Yazi's anonymised and aggregated transaction database, representing South Africa's value-conscious consumer segment (approximately 70% Capitec customers).

All income data verified through credit application records—not self-reported income estimates.

Merchants Covered:

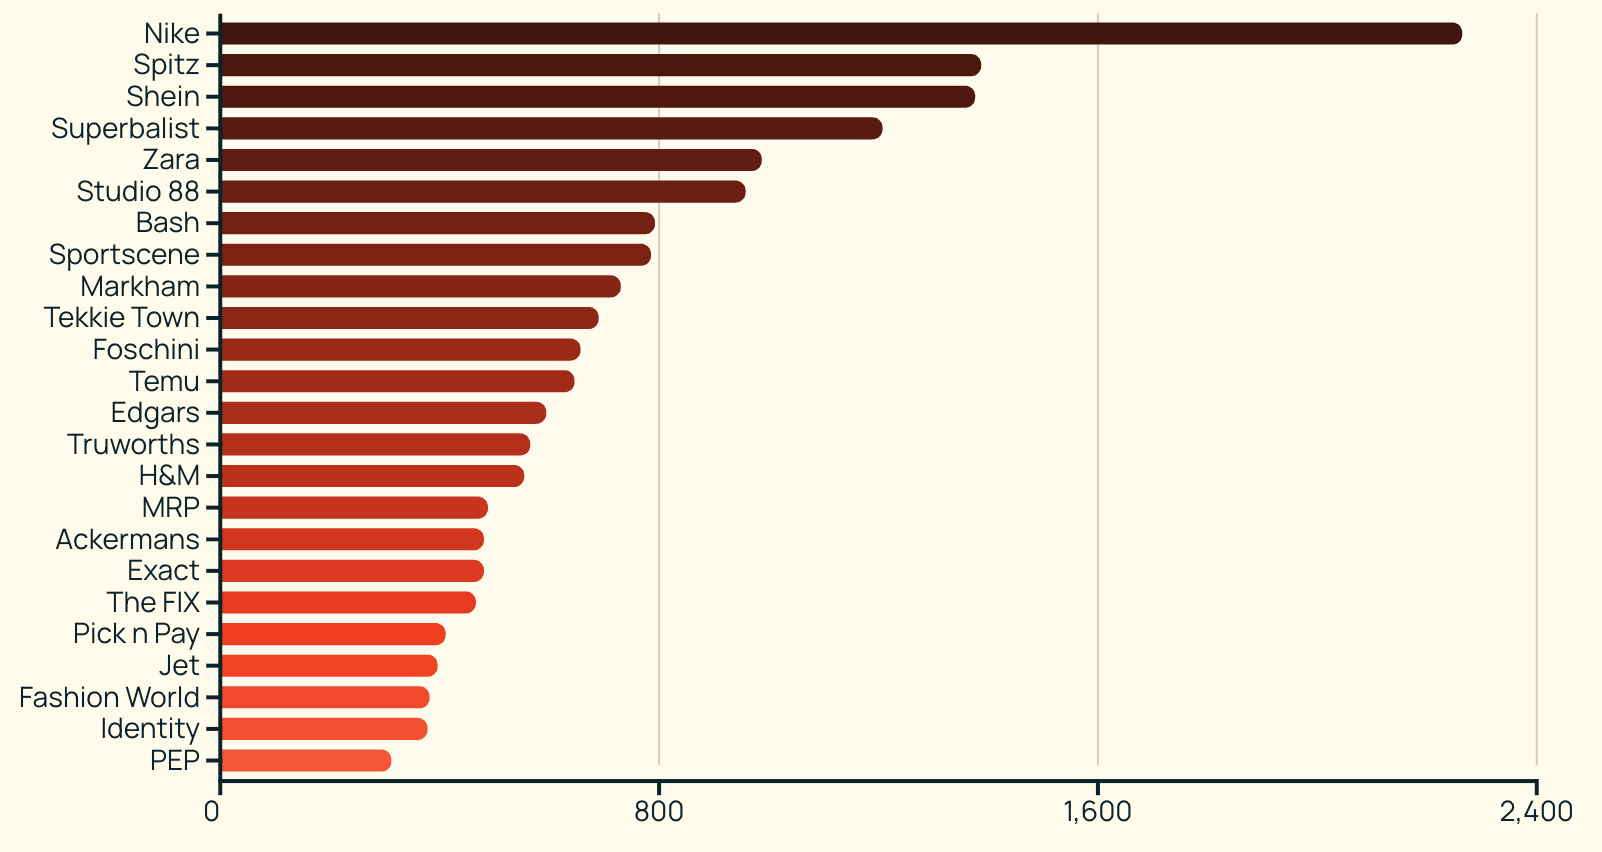
Ackermans • Bash • Edgars • Exact • Fashion World • Foschini • H&M • Identity • Jet • Markham • MRP • Nike • PEP • Pick n Pay Clothing • Shein • Spitz • Sportscene • Studio 88 • Superbalist • Tekkie Town • Temu • The FIX • Truworths • Zara

Note: Woolworths excluded due to inability to separate food and clothing transactions in bank statement descriptors.

Download now

Thank you! Your submission has been received!
Oops! Something went wrong while submitting the form.