%202.png)
Use AI to automate analysis of survey responses and generate a presentation of the key insights with graphs
What we need
- ChatGPT Code Interpreter
- OR Notable ChatGPT
Summary
- Out the box: Out the box analysis with simple prompts
- Open text: Coded next to answer in column, summarised in counts and proportions
- Cleaned: Convert ordinal & Yes/No question answers to numbers for correlation analysis and return CSV back to me
- Multi-select: Quantify multi-select question answers - count occurrences and calculate % proportions
- Table summary: Summary of each question’s answers in table format - occurrences and % proportions
- Cross-section: Segment and cross-section data into groups and analyse the differences between them
- Correlation: Discover correlations and relationships between different answers and segments
- Insights: Top insights from data, particularly to do with correlations in written format
- Graphs: Produce graphs in my brand colours of the most interesting datapoints
- Presentation: Formats the graphs and insight so that they can be pasted into a slide deck with recommendations for formatting.
Sequence
Ground rules for GPT
Do not fill in blank cells or nulls with 'made up' values. Please reverse this and for all future calculations, do not include those nulls in calculations. The best course of action is to filter out all the rows with nulls and exclude them from calculations.
OR, You might see some of the responses in the {insert column} as floats, not strings, probably due to missing values. Let's handle these missing values by replacing them with an empty string and then try preprocessing the responses again.
Out the box analysis and prompts
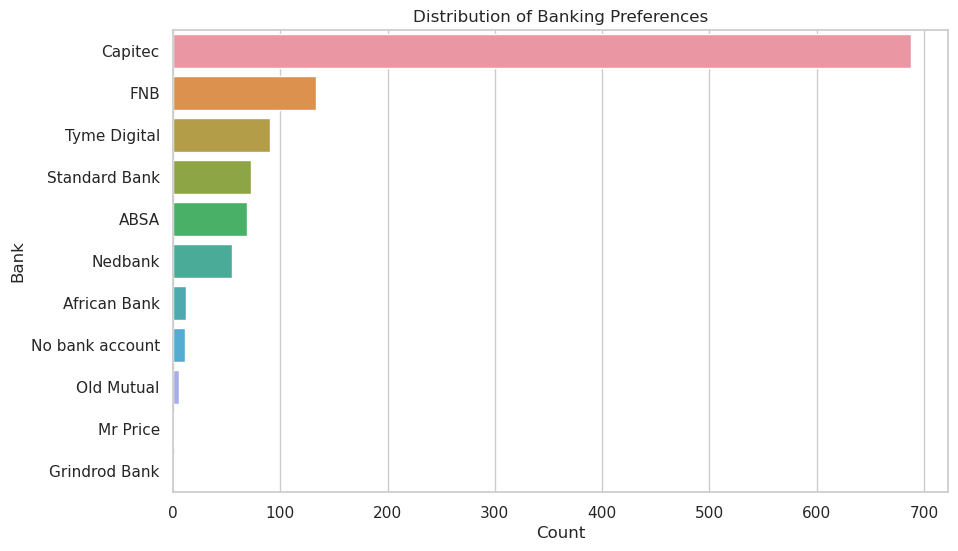
Analyse '{insert CSV}' and show me 2-3 interesting visualisations with a precise insight in 3-4 bullet points
Step by step sequence to thoroughly analyse the full set of responses
Section 1: Open Text Processing
Heading: Open Text Analysis and Categorisation
Rationale: This section seeks to categorise open text responses based on the presence of specific keywords. It then summarises the categories in terms of counts and proportions.
"Could you analyse the open text responses in the dataset from the column ‘{insert column}’. Add a column next called {insert column} categorisation next to this {insert column} in {insert CSV} and list the category in each row. Code the answers into 1 or 2 of the categories listed below. If there are more than 2 categories per response, separate the categories by comma in the cell.
Prompt 1:
"Could you analyse the open text responses in the dataset from the column ‘{insert column}’? Identify common themes or keywords and categorise the responses based on them.
Add a column next called “{insert column} categories” next to it and list the category in each row. If there are more than 2 categories per response, separate the categories by comma in the cell.
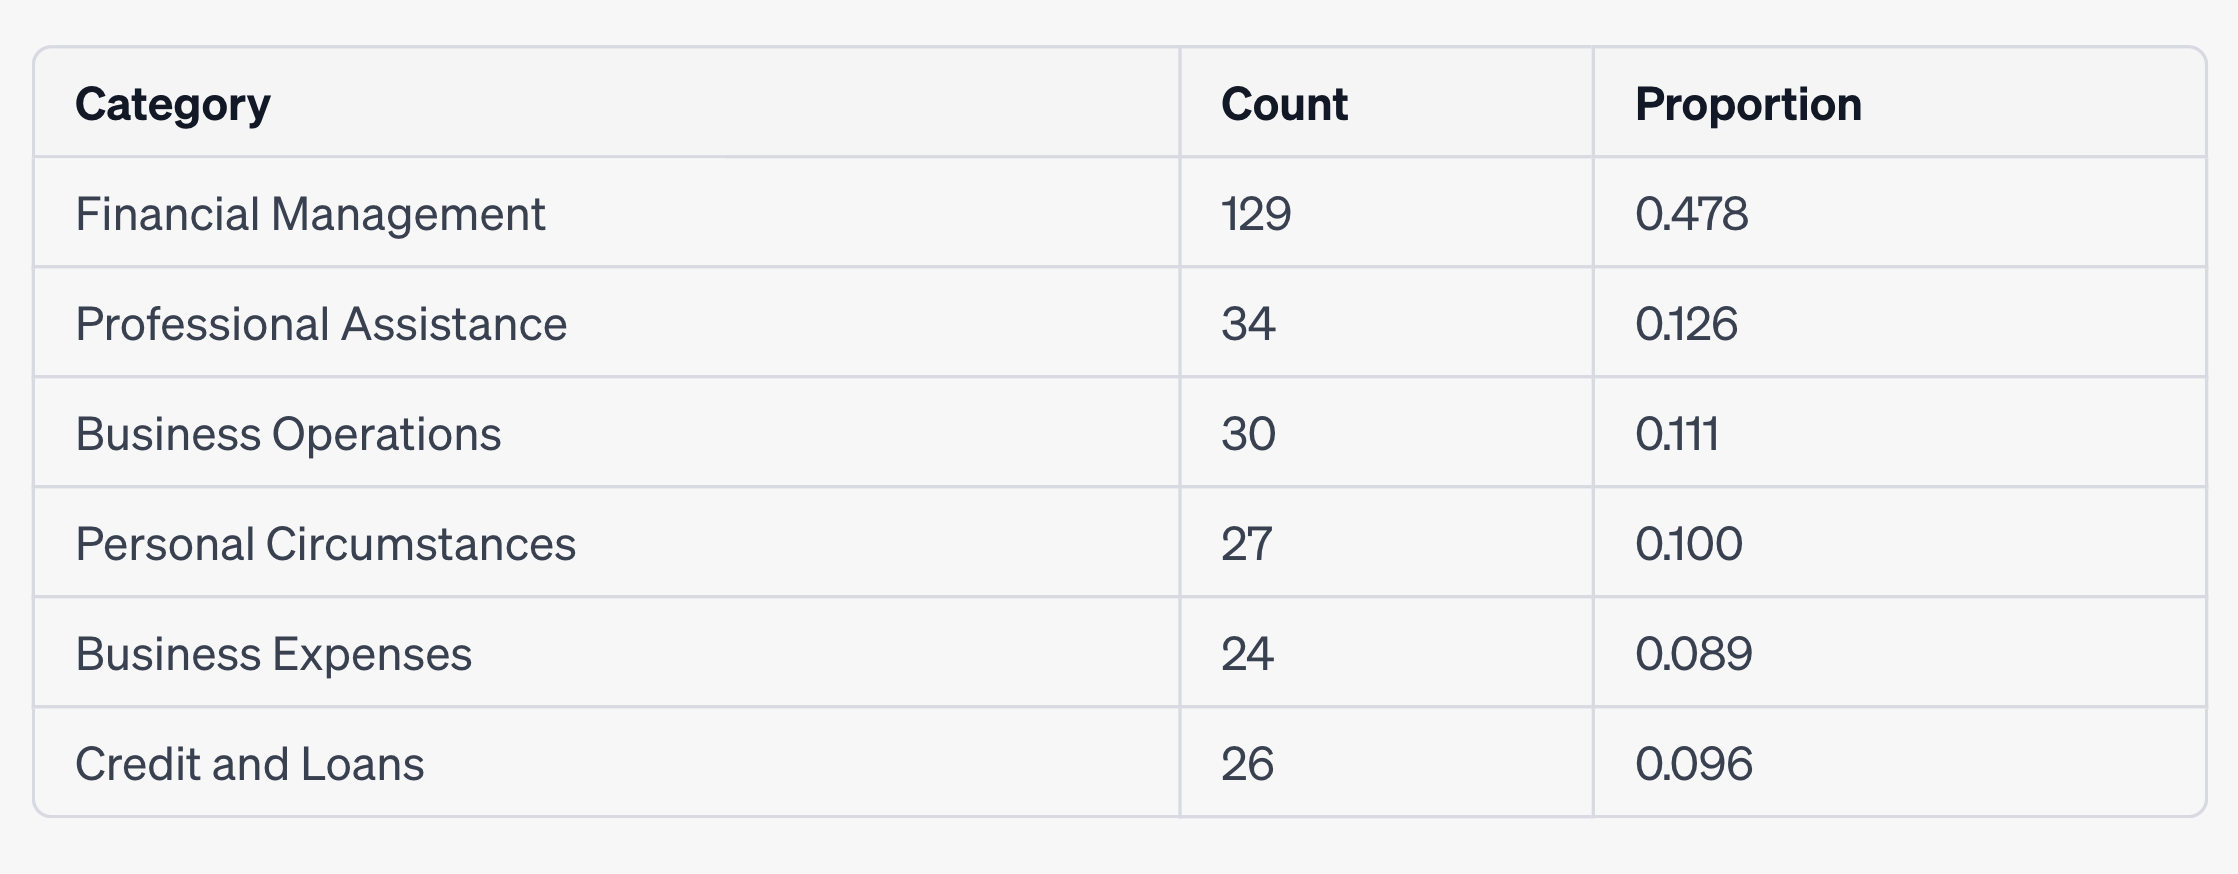
Then, provide a summary of these categories in terms of counts and proportions.
Prompt 2:
"Please process the open-ended responses in our survey data. Use keyword detection or theme identification to group these responses into categories. Once you have these categories, give me a count and proportion of each."
Code Interpreter or GPT-3.5 should first identify the categories that it wants to code the responses into. You do not need to give it all the responses for it to do this
Section 2: Data Cleaning
Heading: Conversion of Ordinal and Yes/No Responses
Rationale: This section converts ordinal and yes/no responses to numerical values to allow for correlation analysis. The cleaned data is then returned in a CSV format.
Prompt 1:
"Can you convert the ordinal and yes/no question responses to numerical values? For example, 'Strongly agree' to 5 and 'Yes' to 1. Once done, save the cleaned data as a CSV file and return it."
Prompt 2:
"Please transform the ordinal and yes/no answers into numerical representations, such as mapping 'Strongly Disagree' to 1 and 'Yes' to 1. Afterward, export the cleaned data into a CSV file."
Section 3: Multi-Select Responses
Heading: Analysis of Multi-Select Responses
Rationale: This section aims to quantify the responses of multi-select questions by counting the occurrences of each option and calculating their proportions.
Prompt 1:
"Could you analyze the multi-select questions in the survey data - {insert columns}? The individual answers are separated by a comma. Count the number of times each option was selected and calculate the proportion this represents of all the responses. Make it such that the answers can be used in cross-sectional calculations in future or so that they can be used in ‘breakdowns’ for other answers.
Prompt 2:
"Please quantify the answers to the multi-select questions. Determine how often each option was chosen and what percentage of total responses this count represents."
Section 4: Summary Tables
Heading: Summary Statistics of Survey Responses
Rationale: This section generates a summary table showing the frequency and proportion of each answer for all questions.
Prompt 1:
"Can you generate a summary table of the survey responses in ’'{insert CSV name}'? For each question, include the count and percentage of each answer option. Question should occupy 3 columns: the question in as the heading with the options below, a column called Count which counts the occurrence's and a column called Proportion which calculates the %.
Each set of question results should be next to each other so there should be 3x the amount of columns that you calculate.
Give the results back to me in a new CSV called '{insert CSV name}'
Prompt 2:
"Please create a summary table for our survey data. This table should show the number and proportion of each response for every question."
Section 5: Cross-Sectional Analysis
(Best to use Notable Plugin for this one)
Heading: Segmentation and Cross-Sectional Analysis
Rationale: This section segments the data into different groups and compares the responses between these groups.
Prompt 1:
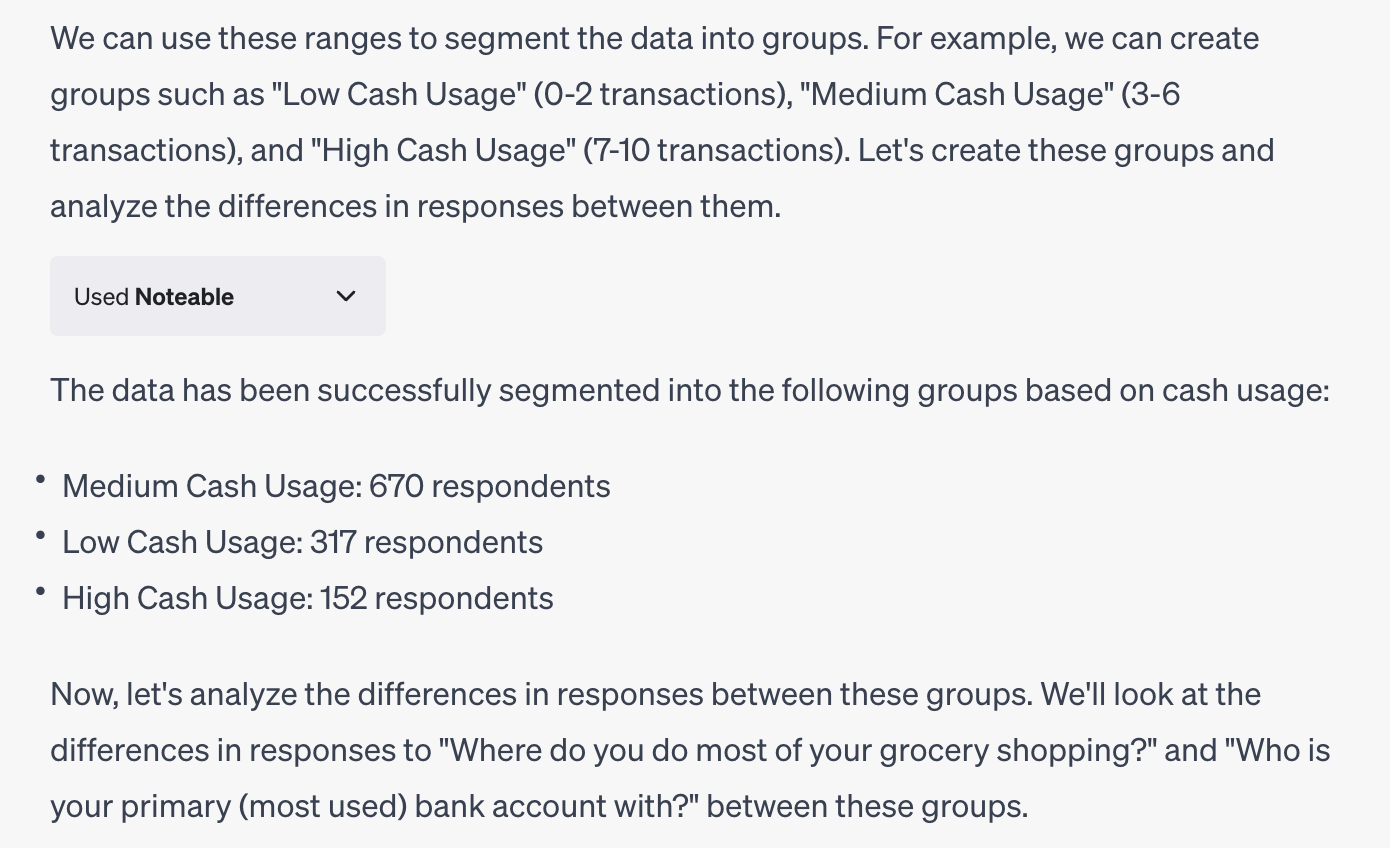
“Can you segment the data into meaningful groups based on respondent demographics or the below question? Then, analyze the differences in responses between these groups."
Please analyze the groups across other answers in a proportionate way and not by just counting how many answered x within a group. This enables us to do a fair comparison if there is an uneven split between the count of respondents in the group.
Prompt 2:
"Please divide the survey data into relevant segments, such as by age or gender. Then, compare the responses across these segments."
Prompt 3:
I'm looking for a way to segment [data set] into different groups based on [criteria] and analyze the differences between them.
Section 6: Correlation Analysis
Heading: Discovery of Relationships and Correlations
Rationale: This section identifies correlations between different questions or segments of the survey data.
Prompt 1:
"Could you analyze the survey data for correlations? Identify any significant relationships between different answers and segments."
Prompt 2:
"Please examine the survey data for correlations. I'm interested in any strong relationships between different responses or segments."
Section 7: Insights
Heading: Extraction of Key Insights
Rationale: This section aims to derive key insights from the data, focusing on correlations and trends.
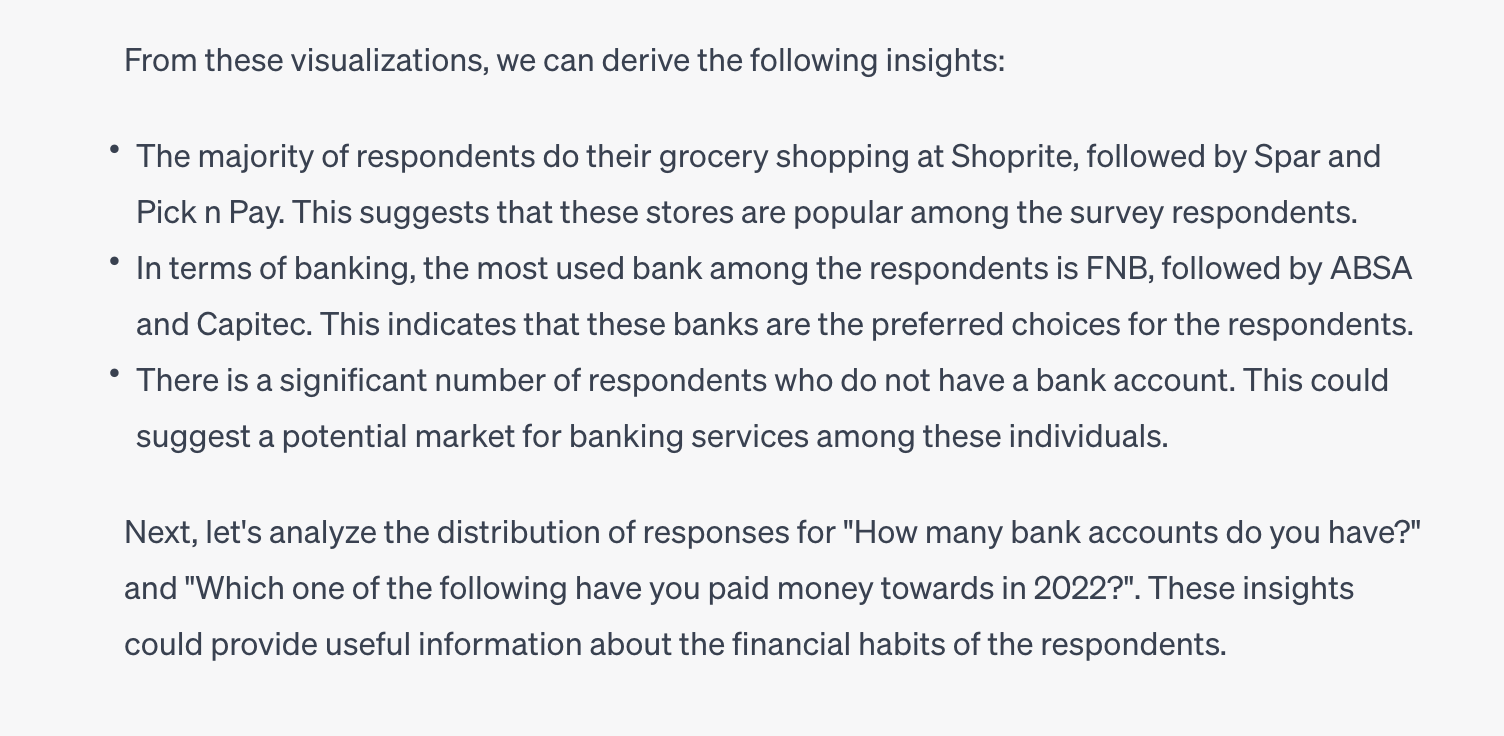
Prompt 1:
"Can you derive key insights from the survey data? I'm particularly interested in correlations and trends in the data."
Prompt 2:
"Please provide me with the most significant insights from the survey data, paying special attention to trends and correlations."
Section 8: Graphs & Visualizations
Heading: Generation of Graphs and Visualizations
Rationale: This section creates visual representations of the most interesting data points, using specific brand colors.
Prompt 1:
"Could you create graphs to visualize the most interesting data points from the survey? Please use my brand colors for these visualizations."
Prompt 2:
"Please generate visualisations of the most significant data points from the survey. Make sure to incorporate my brand colours in these graphics."

